

Measure the Shape
Five normalized metrics form a five-dimensional statistical profile. Centering the measurements reveals relative strengths and weaknesses.

Five core metrics. One statistical profile.
TiMBaseball starts with five familiar, meaningful statistics and normalizes them to a common 0–10 scale, creating a consistent statistical portrait of each player.
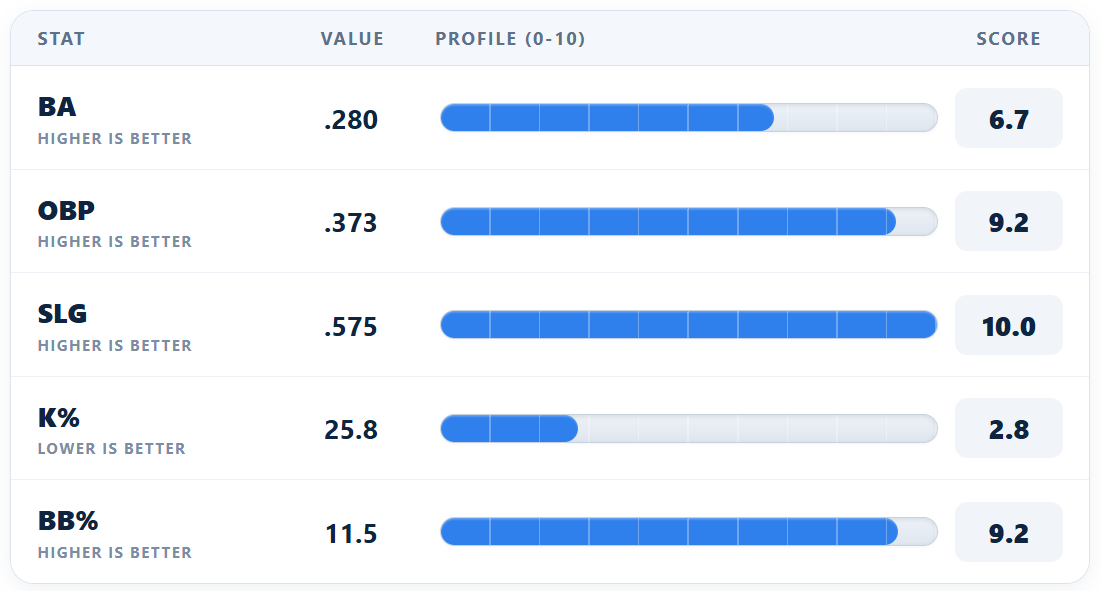
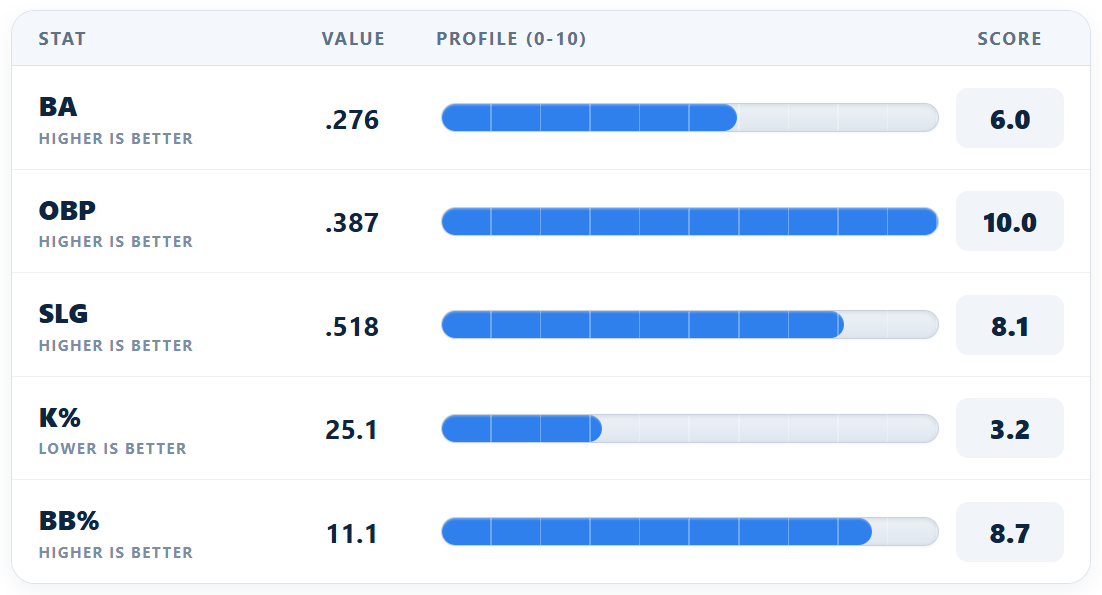
Two players can have different Overall Scores while sharing a remarkably similar statistical shape. TiMBaseball looks beyond performance to identify the structure of a player's profile.
Five normalized metrics form a five-dimensional statistical profile. Centering the measurements reveals relative strengths and weaknesses.
Statistical geometry reveals recurring profile structures. By studying hundreds of player profiles, TiMBaseball identifies recurring statistical patterns that help define different types of hitters.
Each player's profile is compared with a dictionary of representative shapes. Geometric distance identifies the closest statistical archetype.
Different levels of performance can share the same underlying statistical shape.
TiMBaseball uses the same core player profile to explore change, comparison, similarity and context.
See what changed from season to season and which parts of the profile drove it.
Put two statistical profiles side by side and see where each player has the advantage.
Five-dimensional profile geometry finds players with similar statistical shapes.
Identity, State and Value help translate the underlying measurements into context.
Modern baseball provides an enormous amount of data. TiMBaseball takes a deliberately narrower approach: start with a few solid core measurements, build a consistent profile, then add context where it helps.
The result is an analytics system designed to help you see the player without making you stare at the entire spreadsheet.
The models are continuously tested against player populations, historical movement and alternative approaches.
Examining the relationship between production and expected production from the Overall profile.
Testing whether Fantasy State classifications separate subsequent player outcomes.
Comparing players against statistically similar profiles using nearest-neighbor geometry.
Measuring how offensive environments affect Batter Analyzer Overall Scores.
Methodology documents, validation studies and supporting analysis.